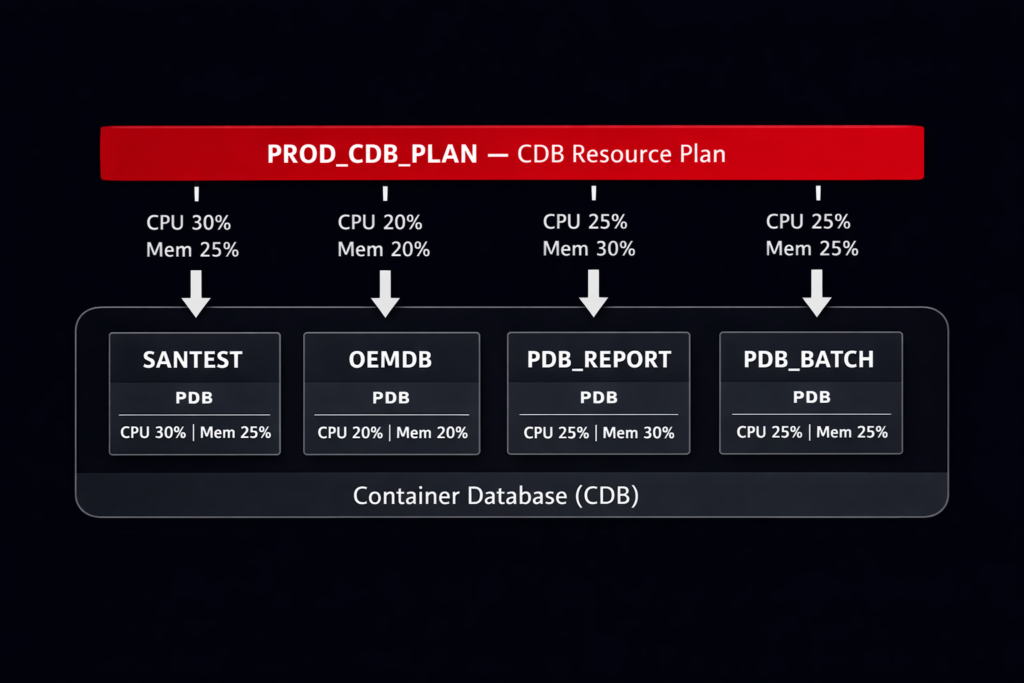
We had four PDBs on the same CDB running without any Oracle PDB resource plan for CPU and memory isolation. Three of them handled routine OLTP workloads — order processing, user authentication, a reporting schema. The fourth was a batch analytics PDB that ran nightly aggregations across three years of transactional history.
For the first two months after go-live, the batch window ran from midnight to 3 AM with no issues. Then the business added a new aggregation job. The batch window extended to 5 AM. At 4:15 AM, before the batch finished, the morning shift in Asia started logging in. The OLTP PDBs slowed to a crawl. Response times that normally sat under 100ms climbed past 2 seconds. The batch job had taken every available CPU thread the host could offer, and the CDB had no instruction to give any of it back.
The root cause was simple: we had created the PDBs, set storage limits, configured undo and temp tablespaces — and never set a CDB resource plan. Without one, Oracle’s Resource Manager has no directive to enforce. Every PDB competes equally for every resource on the host.
That incident was the first time we properly configured PDB-level resource plans. This post covers what we put in place.
Validated on: Oracle Database 19c Enterprise Edition — Production
How CDB Resource Plans Work — The DBA Version
Oracle Resource Manager in a Multitenant environment operates at two levels:
- CDB Resource Plan — controls how resources are divided between PDBs at the container level
- PDB Resource Plan — controls how resources are divided between sessions within a single PDB
Both levels can coexist. The CDB plan governs the PDB’s share of the overall host resources. The PDB plan governs how that share is distributed internally.
The key object is the CDB Resource Plan Directive — one directive per PDB, attached to the CDB-level plan. Each directive specifies:
| Parameter | What It Controls |
|---|---|
shares | Relative CPU weight when the host is under contention |
utilization_limit | Hard CPU cap as a percentage of host CPU — enforced always |
parallel_server_limit | Cap on parallel query servers this PDB can consume |
memory_min_percent | Minimum memory guaranteed to this PDB under pressure |
memory_limit_percent | Maximum memory this PDB can consume |
shares is proportional — a PDB with 4 shares gets twice the CPU of a PDB with 2 shares when contention exists. utilization_limit is absolute — a PDB with utilization_limit = 30 cannot consume more than 30% of host CPU regardless of what other PDBs are doing.
The combination of both is what we use in production. Shares handle normal operation. Utilization limits protect OLTP PDBs from a runaway batch PDB.
Step 1 — Check What Is Currently in Place
Before creating anything, we check whether a CDB resource plan is already active:
SET LIN 300
COL name  FORMAT A30
COL value FORMAT A40

SELECT name,
       value
FROM   v$parameter
WHERE  name = 'resource_manager_plan';
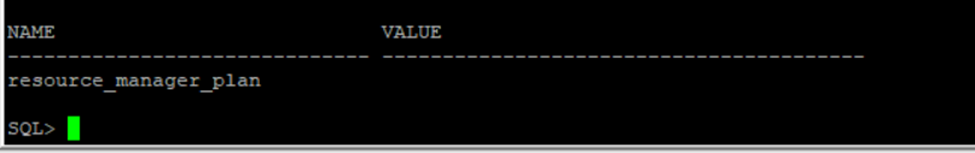
A null value means Resource Manager is running with no active plan — every PDB competes equally. We also check whether any plans already exist:
COL plan_id FORMAT 999999
COL plan    FORMAT A30
COL status  FORMAT A15

SELECT plan,
       plan_id,
       status,
       mandatory
FROM   dba_cdb_rsrc_plans
ORDER  BY plan;
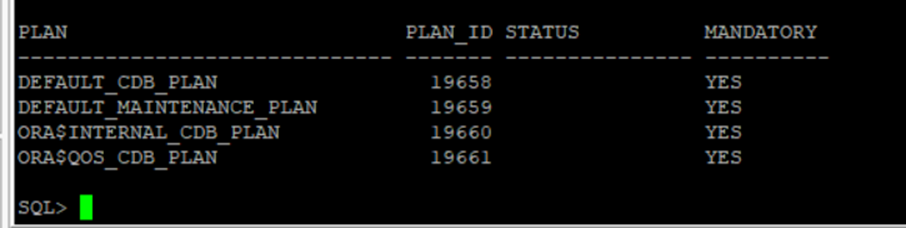
DEFAULT_CDB_PLAN exists in every Oracle installation but is not activated by default. It applies equal shares to all PDBs with no utilization limits — effectively no isolation. We create a custom plan rather than modifying the default.
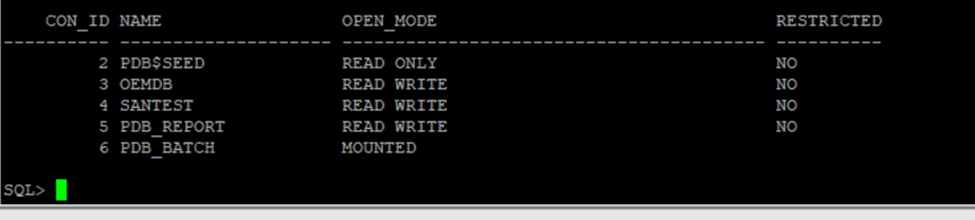
List the PDBs currently in the CDB:
COL name       FORMAT A20
COL open_mode  FORMAT A40
COL restricted FORMAT A10

SELECT con_id,
       name,
       open_mode,
       restricted
FROM   v$pdbs
ORDER  BY con_id;
Step 2 — Create the CDB Resource Plan
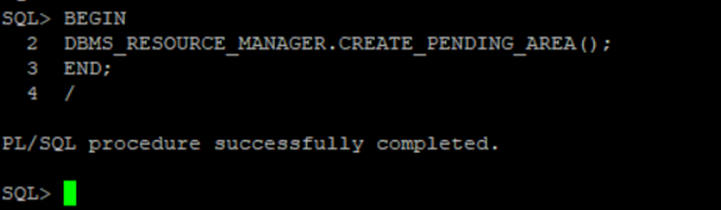
We create the plan using DBMS_RESOURCE_MANAGER. The procedure calls must happen inside a pending area — a staging context that Oracle validates before committing:
BEGIN
DBMS_RESOURCE_MANAGER.CREATE_PENDING_AREA();
END;
/
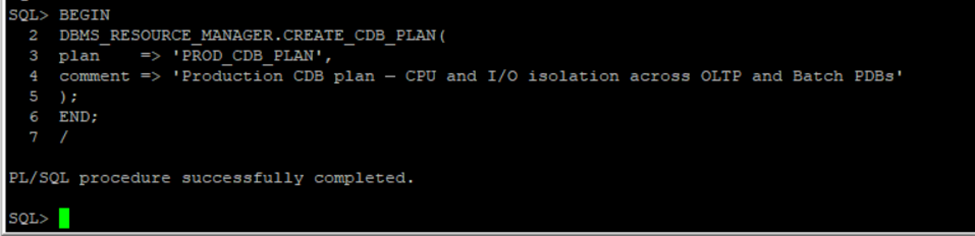
BEGIN
DBMS_RESOURCE_MANAGER.CREATE_CDB_PLAN(
plan => 'PROD_CDB_PLAN',
comment => 'Production CDB plan — CPU and I/O isolation across OLTP and Batch PDBs'
);
END;
/
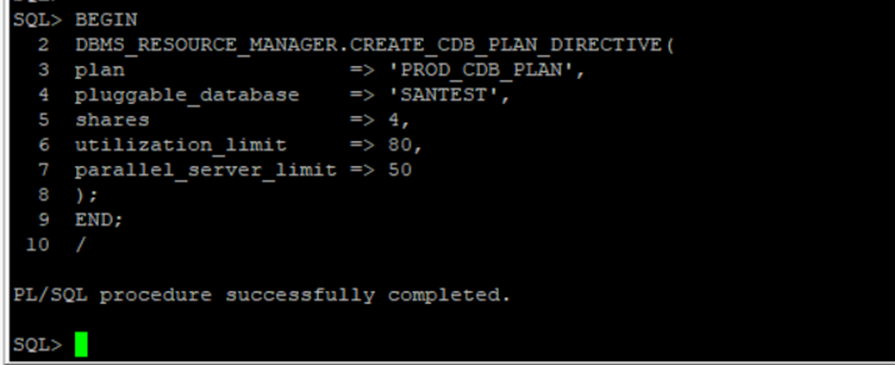
Step 3 — Create Directives for Each PDB
Each PDB gets its own directive. We set shares and utilization limits based on the workload profile — OLTP PDBs get protected ceiling guarantees, the batch PDB gets a hard CPU cap.
SANTEST — highest priority OLTP workload, 4 shares and an 80% utilization ceiling:
BEGIN
  DBMS_RESOURCE_MANAGER.CREATE_CDB_PLAN_DIRECTIVE(
    plan                  => 'PROD_CDB_PLAN',
    pluggable_database    => 'SANTEST',
    shares                => 4,
    utilization_limit     => 80,
    parallel_server_limit => 50
  );
END;
/
OEMDB — standard OLTP workload, same weight as SANTEST:
BEGIN
  DBMS_RESOURCE_MANAGER.CREATE_CDB_PLAN_DIRECTIVE(
    plan                  => 'PROD_CDB_PLAN',
    pluggable_database    => 'OEMDB',
    shares                => 4,
    utilization_limit     => 80,
    parallel_server_limit => 50
  );
END;
/
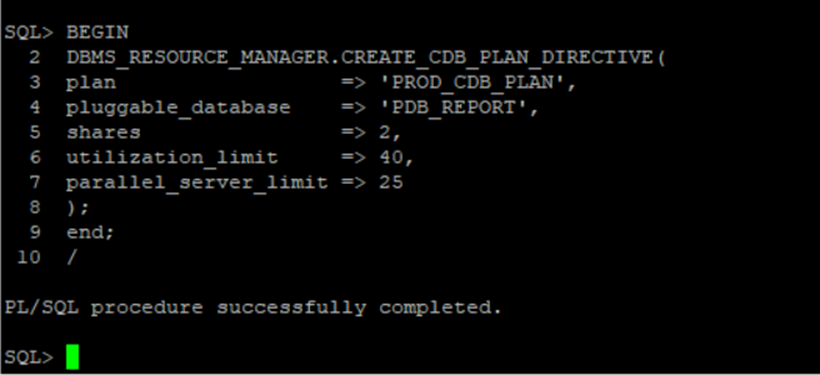
PDB_REPORT — medium priority, moderate cap to prevent reporting queries from impacting OLTP:
BEGIN
  DBMS_RESOURCE_MANAGER.CREATE_CDB_PLAN_DIRECTIVE(
    plan                  => 'PROD_CDB_PLAN',
    pluggable_database    => 'PDB_REPORT',
    shares                => 2,
    utilization_limit     => 40,
    parallel_server_limit => 25
  );
END;
/
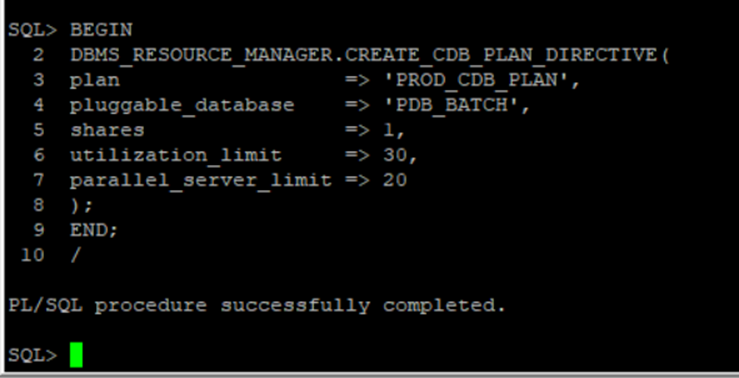
PDB_BATCH — lowest priority, hard CPU cap prevents OLTP starvation during batch window overlap:
BEGIN
  DBMS_RESOURCE_MANAGER.CREATE_CDB_PLAN_DIRECTIVE(
    plan                  => 'PROD_CDB_PLAN',
    pluggable_database    => 'PDB_BATCH',
    shares                => 1,
    utilization_limit     => 30,
    parallel_server_limit => 20
  );
END;
/
The utilization_limit values here are starting points, not universal prescriptions. A 30% cap on the batch PDB was right for our host with 32 CPU threads. The right number depends on host CPU count, batch window overlap with OLTP hours, and acceptable batch completion time.
Step 4 — Update Directives: Memory and Tuning Adjustments
After initial creation, we update directives to add memory isolation parameters and tune the resource allocations based on workload observations. Updates also happen inside a fresh pending area:
BEGIN
  DBMS_RESOURCE_MANAGER.CREATE_PENDING_AREA();
END;
/
[Output image here]
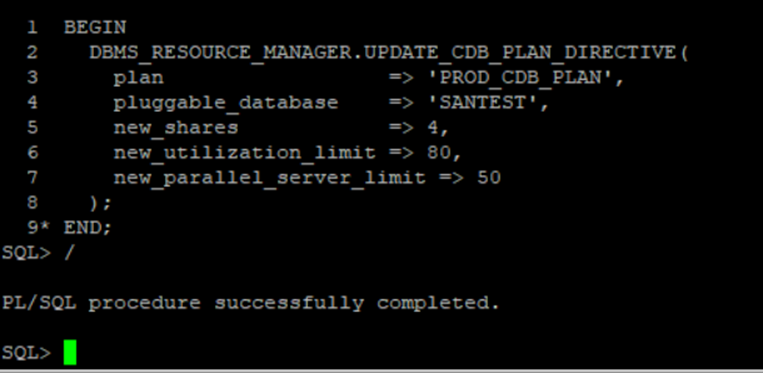
SANTEST — confirm CPU allocation:
BEGIN
  DBMS_RESOURCE_MANAGER.UPDATE_CDB_PLAN_DIRECTIVE(
    plan                      => 'PROD_CDB_PLAN',
    pluggable_database        => 'SANTEST',
    new_shares                => 4,
    new_utilization_limit     => 80,
    new_parallel_server_limit => 50
  );
END;
/
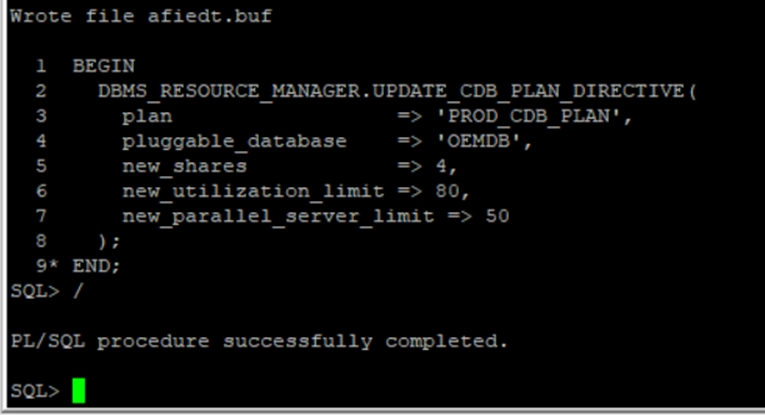
OEMDB — confirm CPU allocation:
BEGIN
  DBMS_RESOURCE_MANAGER.UPDATE_CDB_PLAN_DIRECTIVE(
    plan                      => 'PROD_CDB_PLAN',
    pluggable_database        => 'OEMDB',
    new_shares                => 4,
    new_utilization_limit     => 80,
    new_parallel_server_limit => 50
  );
END;
/
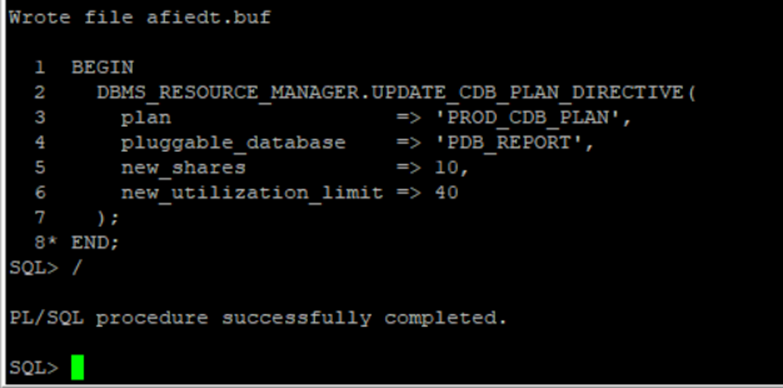
PDB_REPORT — add memory isolation. memory_min_percent sets the guaranteed floor; memory_limit_percent sets the ceiling:
BEGIN
  DBMS_RESOURCE_MANAGER.UPDATE_CDB_PLAN_DIRECTIVE(
    plan                     => 'PROD_CDB_PLAN',
    pluggable_database       => 'PDB_REPORT',
    new_memory_min_percent   => 10,
    new_memory_limit_percent => 40
  );
END;
/
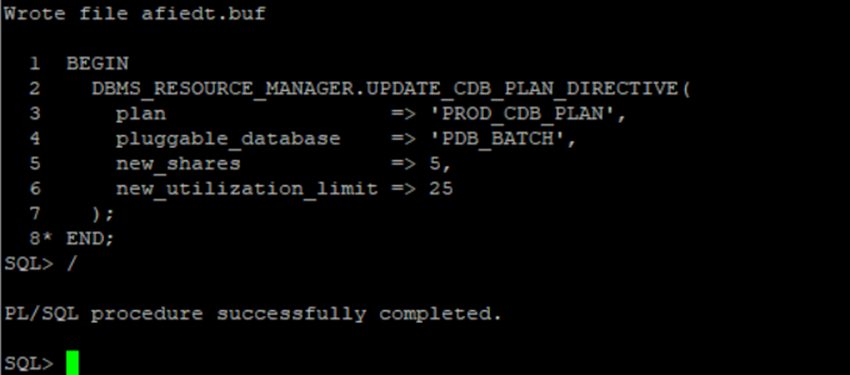
PDB_BATCH — add memory isolation. Lower floor and ceiling than OLTP PDBs — batch workloads tolerate memory pressure better than interactive sessions:
BEGIN
  DBMS_RESOURCE_MANAGER.UPDATE_CDB_PLAN_DIRECTIVE(
    plan                     => 'PROD_CDB_PLAN',
    pluggable_database       => 'PDB_BATCH',
    new_memory_min_percent   => 5,
    new_memory_limit_percent => 25
  );
END;
/
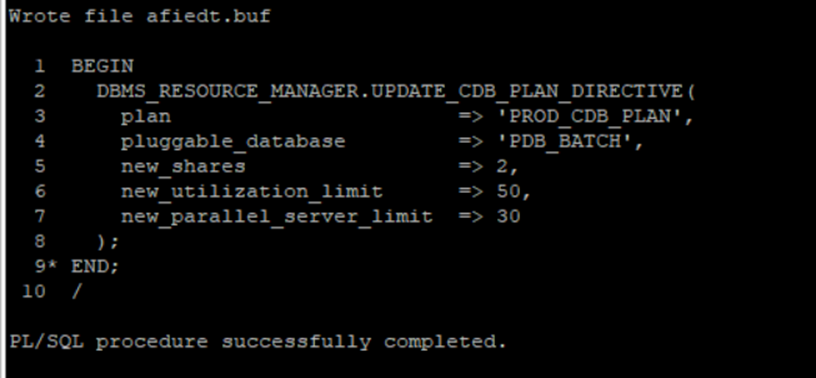
PDB_BATCH — adjust CPU after first load test observation:
BEGIN
  DBMS_RESOURCE_MANAGER.UPDATE_CDB_PLAN_DIRECTIVE(
    plan                      => 'PROD_CDB_PLAN',
    pluggable_database        => 'PDB_BATCH',
    new_shares                => 2,
    new_utilization_limit     => 50,
    new_parallel_server_limit => 30
  );
END;
/
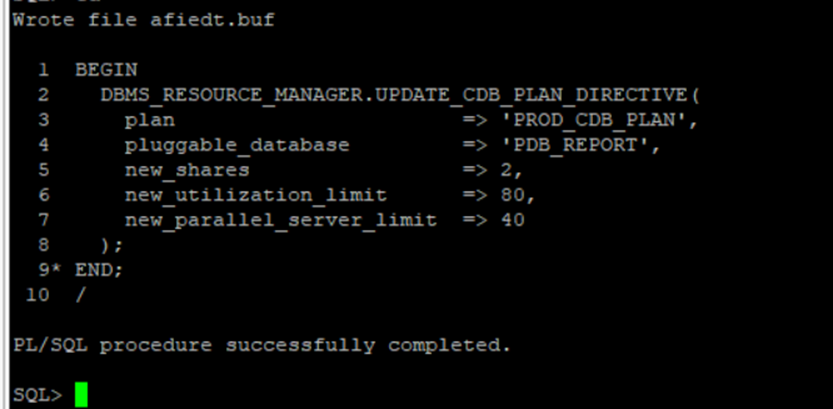
PDB_REPORT — adjust CPU after first load test observation:
BEGIN
  DBMS_RESOURCE_MANAGER.UPDATE_CDB_PLAN_DIRECTIVE(
    plan                      => 'PROD_CDB_PLAN',
    pluggable_database        => 'PDB_REPORT',
    new_shares                => 2,
    new_utilization_limit     => 80,
    new_parallel_server_limit => 40
  );
END;
/
memory_min_percent guarantees a floor — Oracle will not let another PDB push this one below that threshold under memory pressure. memory_limit_percent is the ceiling. The sum of all memory_min_percent values across all PDBs must not exceed 100. The sum of memory_limit_percent values can exceed 100 — Oracle only enforces the ceiling when aggregate demand pushes past available memory.
Step 5 — Validate and Activate
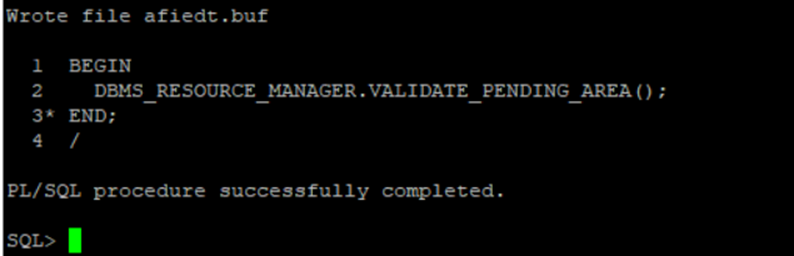
Validate the pending area before committing:
BEGIN
  DBMS_RESOURCE_MANAGER.VALIDATE_PENDING_AREA();
END;
/
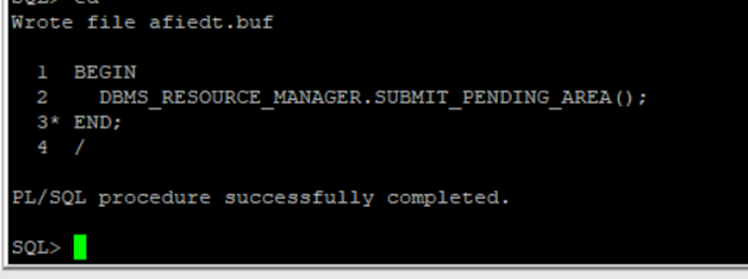
If validation passes without error, submit and activate:
BEGIN
  DBMS_RESOURCE_MANAGER.SUBMIT_PENDING_AREA();
END;
/

ALTER SYSTEM SET resource_manager_plan = 'PROD_CDB_PLAN' SCOPE=BOTH;
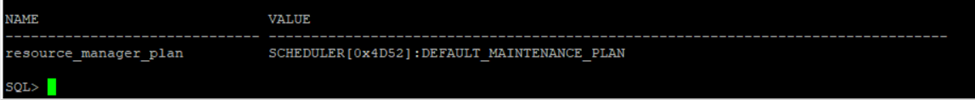
Verify the plan is active and directives are applied:
SELECT name,
       value
FROM   v$parameter
WHERE  name = 'resource_manager_plan';
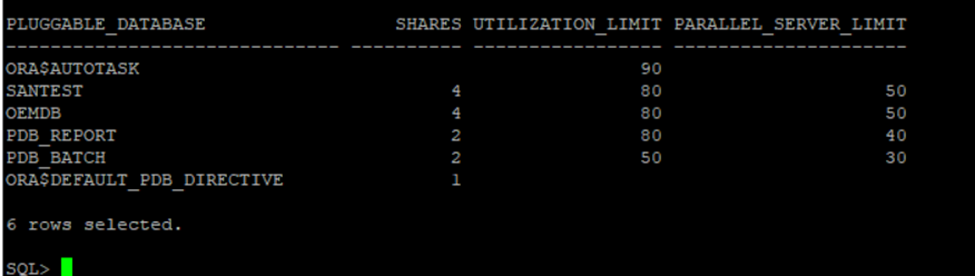
SELECT pluggable_database,
       shares,
       utilization_limit,
       parallel_server_limit
FROM   dba_cdb_rsrc_plan_directives
WHERE  plan = 'PROD_CDB_PLAN'
ORDER  BY shares DESC;
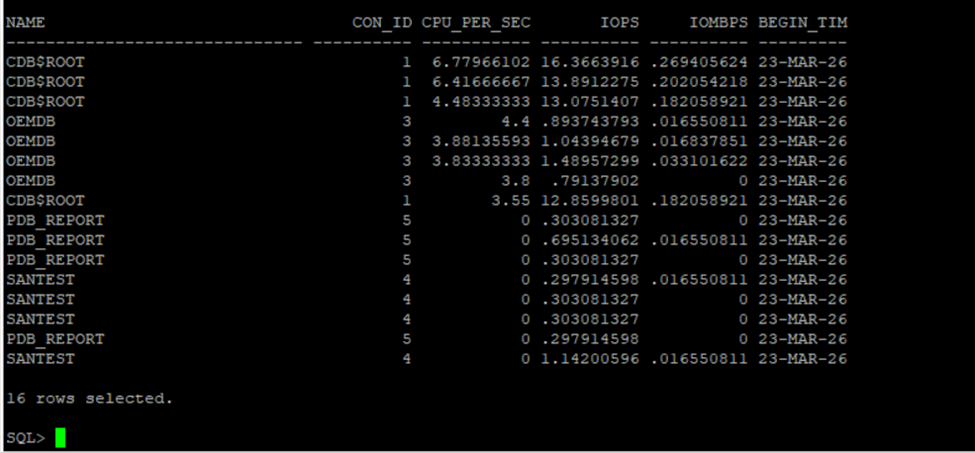
Monitoring Resource Plan Effectiveness
Once the plan is active, we confirm it is enforcing correctly by monitoring resource consumption per PDB:
SELECT c.name,
       m.con_id,
       m.cpu_consumed_time /
         ((m.end_time - m.begin_time) * 86400) AS cpu_per_sec,
       m.iops,
       m.iombps,
       m.begin_time
FROM   v$rsrcpdbmetric_history m
JOIN   v$containers c
    ON m.con_id = c.con_id
WHERE  m.begin_time > SYSDATE - INTERVAL '5' MINUTE
ORDER  BY cpu_per_sec DESC;
For historical analysis, DBA_HIST_RSRC_PDB_METRIC retains the AWR-sampled version of the same data. This view is populated only after AWR snapshots are captured while the plan is active — if the plan was recently activated, run EXEC DBMS_WORKLOAD_REPOSITORY.CREATE_SNAPSHOT() first to force an immediate snapshot, then re-run:
SELECT m.snap_id,
       c.name AS pdb_name,
       ROUND(
         m.cpu_consumed_time /
         ((CAST(s.end_interval_time AS DATE) -
           CAST(s.begin_interval_time AS DATE)) * 86400), 2
       ) AS cpu_per_sec
FROM   dba_hist_rsrc_pdb_metric m
JOIN   dba_hist_snapshot s
    ON  m.snap_id         = s.snap_id
   AND  m.dbid            = s.dbid
   AND  m.instance_number = s.instance_number
JOIN   v$containers c
    ON  m.con_id = c.con_id
WHERE  c.name = 'PDB_BATCH'
-- AND  s.begin_interval_time > SYSDATE - 1   -- uncomment to filter to last 24 hours
ORDER  BY m.snap_id;
[Output image here]
What to Watch After Go-Live
Three things we monitor in the first week after activating a new CDB resource plan:
1. Batch completion time. The utilization cap will extend batch job wall-clock time. We baseline completion time before and after the plan is activated, and verify the business batch window is still met. If the batch is now finishing at 6 AM instead of 5 AM because the cap is too tight, the cap needs adjusting — not removing.
2. OLTP response time. The goal of the plan is to protect OLTP response time during batch overlap windows. We check AWR reports for the overlap period and compare Top Timed Events and Average Active Sessions before and after plan activation.
3. resmgr: cpu quantum wait events. This event appearing in AWR means Resource Manager is actively throttling CPU for a PDB — runnable sessions are being queued because the utilization limit has been hit. A small amount is expected and correct. A consistently high amount means the cap is too aggressive:
SELECT h.snap_id,
       h.event_name,
       h.total_waits,
       ROUND(h.time_waited_micro / 1e6, 2) AS time_waited_secs
FROM   dba_hist_system_event h
JOIN   dba_hist_snapshot s
    ON  s.snap_id = h.snap_id
   AND  s.dbid    = h.dbid
WHERE  h.event_name = 'resmgr: cpu quantum'
AND    h.snap_id > (
         SELECT MAX(snap_id) - 8
         FROM   dba_hist_snapshot
       )
ORDER  BY h.snap_id,
          h.time_waited_micro DESC;
[Output image here]
If this query returns no rows, Resource Manager has not needed to throttle any PDB during the last eight AWR snapshots — the utilization limits were not breached. That is the expected result in a well-sized plan.
Where We Go From Here
This post covered CDB resource plan configuration for CPU and memory isolation across PDBs — the setup that prevents one PDB from starving the others under shared host conditions.
If you have hit unexpected resmgr: cpu quantum contention after activating a CDB resource plan, or if utilization limits are not enforcing as expected — drop it in the comments. The interaction between Resource Manager and parallel query is one area where the behavior is not always what the documentation implies.
Usefull Resources :
- How to Drop a Pluggable Database Including Datafiles in Oracle 19c
- Oracle ASM 19c Installation: Complete Guide to Oracle Restart Grid Infrastructure [2025]
- DBA_HIST_ACTIVE_SESS_HISTORY: Complete Guide to Oracle ASH Analysis
- Oracle 23ai — Why Oracle Calls It The AI Database
- Oracle Vector Search: Your First Hands-On Walkthrough
2 thoughts on “Managing PDB Resources: CPU and Memory Isolation Done Right”