
Introduction
Have you ever been asked to explain why your Oracle database was slow last Tuesday at 2:30 PM? Or needed to identify which SQL statements were causing CPU spikes during last night’s batch run?
This is where DBA_HIST_ACTIVE_SESS_HISTORY becomes your most powerful diagnostic tool.
Recently, we faced a production issue where users reported intermittent slowness between 9 AM and 11 AM over the past week. The database was running fine when we checked, but we needed to understand what happened during those historical time windows. Using DBA_HIST_ACTIVE_SESS_HISTORY, we identified a specific query pattern that was causing resource contention, even though the symptoms had disappeared by the time we started investigating.
In this comprehensive guide, I’ll show you exactly how to use DBA_HIST_ACTIVE_SESS_HISTORY for performance troubleshooting, capacity planning, and historical analysis.
What is DBA_HIST_ACTIVE_SESS_HISTORY?
DBA_HIST_ACTIVE_SESS_HISTORY (often called “ASH” or “historical ASH”) is Oracle’s repository for Active Session History data. It stores snapshots of active database sessions, capturing what was running, what resources were being used, and what sessions were waiting for.
Think of it as a DVR for your database – it records everything so you can replay and analyze what happened in the past.
Key Characteristics:
| Feature | Details |
|---|---|
| Sampling Rate | Every 10 seconds (from V$ACTIVE_SESSION_HISTORY) |
| Retention | Typically 7-8 days (AWR retention period) |
| Storage | SYSAUX tablespace |
| Overhead | Minimal (data sampled, not every transaction) |
| Use Case | Historical performance analysis |
DBA_HIST_ACTIVE_SESS_HISTORY vs V$ACTIVE_SESSION_HISTORY
V$ACTIVE_SESSION_HISTORY:
- Real-time data (in memory)
- Samples every 1 second
- Retention: typically ~1 hour (but depends on memory)
- Use for: Active, ongoing issues
DBA_HIST_ACTIVE_SESS_HISTORY:
- Historical data (persistent)
- Samples every 10 seconds
- Retention: 7-8 days (default AWR retention)
- Use for: Past performance analysis
Golden Rule: Use V$ for “what’s happening now”, use DBA_HIST for “what happened then”.
Understanding Key Columns
Before diving into queries, let’s understand the most important columns:
-- See all columns
DESC dba_hist_active_sess_history;
Essential Columns:
| Column | What It Tells You |
|---|---|
| SAMPLE_TIME | When the sample was taken |
| SESSION_ID / SESSION_SERIAL# | Which session |
| SQL_ID | Which SQL statement was running |
| EVENT | What the session was waiting for (if anything) |
| WAIT_CLASS | Category of wait (User I/O, CPU, etc.) |
| WAIT_TIME | How long the wait was (microseconds) |
| SESSION_STATE | ON CPU or WAITING |
| BLOCKING_SESSION | Who was blocking this session (if applicable) |
| PROGRAM | Application/client program name |
| MODULE / ACTION | Application context |
SQLPlus Formatting for Clean Output
Before running ASH queries, set up your SQLPlus environment for readable output:
-- Basic formatting
SET LINESIZE 200
SET PAGESIZE 1000
SET TIMING ON
SET ECHO OFF
SET FEEDBACK ON

-- Column formatting for common ASH columns
COLUMN sample_time FORMAT A20
COLUMN sql_id FORMAT A13
COLUMN event FORMAT A40
COLUMN wait_class FORMAT A20
COLUMN session_state FORMAT A10
COLUMN program FORMAT A30
COLUMN module FORMAT A30
Pro Tip: Save these settings in your login.sql file so they apply automatically whenever you connect.
Basic Query Structure
Template for most ASH queries:
-- SQLPlus formatting
SET LINESIZE 200
SET PAGESIZE 100
COLUMN sample_time FORMAT A20
COLUMN sql_id FORMAT A13
COLUMN event FORMAT A40
COLUMN samples FORMAT 999,999

SELECT
    TO_CHAR(SAMPLE_TIME, 'YYYY-MM-DD HH24:MI:SS') AS sample_time,
    SESSION_ID,
    SQL_ID,
    EVENT,
    WAIT_CLASS,
    SESSION_STATE,
    -- Add other columns as needed
    COUNT(*) samples
FROM
    DBA_HIST_ACTIVE_SESS_HISTORY
WHERE
    SAMPLE_TIME BETWEEN TO_DATE('2024-12-17 09:00:00','YYYY-MM-DD HH24:MI:SS')
                    AND TO_DATE('2024-12-17 11:00:00','YYYY-MM-DD HH24:MI:SS')
GROUP BY
    TO_CHAR(SAMPLE_TIME, 'YYYY-MM-DD HH24:MI:SS'),
    SESSION_ID,
    SQL_ID,
    EVENT,
    WAIT_CLASS,
    SESSION_STATE
ORDER BY
    samples DESC;
Key Point: Each row represents one sample (10 seconds). More samples = more active time = more important.
Common Use Cases & Queries
Use Case 1: Top SQL During Specific Time Period
Problem: “What SQL statements were consuming the most database time yesterday between 2 PM and 4 PM?”
-- SQLPlus formatting
SET LINESIZE 200
SET PAGESIZE 50
COLUMN sql_id FORMAT A13
COLUMN sample_count FORMAT 999,999
COLUMN db_time_minutes FORMAT 999,990.99
COLUMN operation FORMAT A15
COLUMN top_wait_event FORMAT A30

SELECT
    sql_id,
    COUNT(*) AS sample_count,
    ROUND(COUNT(*) * 10 / 60, 2) AS db_time_minutes,
    MAX(sql_opname) AS operation,
    MAX(event) keep (dense_rank first order by event) AS top_wait_event
FROM
    dba_hist_active_sess_history
WHERE
    sample_time BETWEEN TO_DATE('2024-12-16 14:00:00','YYYY-MM-DD HH24:MI:SS')
                    AND TO_DATE('2024-12-16 16:00:00','YYYY-MM-DD HH24:MI:SS')
    AND sql_id IS NOT NULL
GROUP BY
    sql_id
ORDER BY
    sample_count DESC
FETCH FIRST 10 ROWS ONLY;
Example Output:
SQL_ID         SAMPLE_COUNT  DB_TIME_MINUTES  OPERATION  TOP_WAIT_EVENT
-------------- ------------ ---------------- ----------- --------------------------
7g5t2a9x8h3n2         3420            570.00  SELECT      db file sequential read
8h6u3b0y9i4o3         2180            363.33  INSERT      log file sync
What it tells you:
- SQL_ID
7g5t2a9x8h3n2was active for 3,420 samples - That’s approximately 570 minutes of database time (3420 × 10 seconds / 60)
- Most common wait was “db file sequential read”
Use Case 2: Wait Event Analysis
Problem: “What were the top wait events during peak hours last week?”
-- SQLPlus formatting
SET LINESIZE 200
SET PAGESIZE 50
COLUMN wait_class FORMAT A15
COLUMN event FORMAT A40
COLUMN samples FORMAT 999,999
COLUMN pct_of_total FORMAT 990.99
COLUMN avg_wait_time_ms FORMAT 999,990.99

SELECT
    wait_class,
    event,
    COUNT(*) AS samples,
    ROUND(COUNT(*) / SUM(COUNT(*)) OVER () * 100, 2) AS pct_of_total,
    ROUND(AVG(time_waited), 2) AS avg_wait_time_ms
FROM
    dba_hist_active_sess_history
WHERE
    sample_time BETWEEN TRUNC(SYSDATE) - 7 + 9/24  -- 9 AM
                    AND TRUNC(SYSDATE) - 7 + 17/24 -- 5 PM
    AND session_state = 'WAITING'
    AND wait_class != 'Idle'
GROUP BY
    wait_class, event
ORDER BY
    samples DESC
FETCH FIRST 15 ROWS ONLY;
Example Output:
WAIT_CLASS    EVENT                          SAMPLES  PCT_OF_TOTAL  AVG_WAIT_MS
------------- ------------------------------ -------- ------------ ------------
User I/O      db file sequential read          12450        35.20        2.15
Concurrency   enq: TX - row lock contention     8230        23.30       45.60
User I/O      db file scattered read            6180        17.50        4.25
Interpretation:
- 35% of wait time was on “db file sequential read” (index lookups)
- 23% was row lock contention (blocking issues)
- Average wait for row locks was 45ms (significant!)
Use Case 3: Identify Blocking Sessions
Problem: “Were there blocking sessions causing slowness last night?”
-- SQLPlus formatting
SET LINESIZE 200
SET PAGESIZE 50
COLUMN sample_time FORMAT A20
COLUMN blocker_sid FORMAT 999,999
COLUMN blocked_session_count FORMAT 999
COLUMN total_blocked_samples FORMAT 999,999
COLUMN blocked_time_minutes FORMAT 999,990.99
COLUMN blocker_sql FORMAT A13

SELECT
    TO_CHAR(sample_time, 'YYYY-MM-DD HH24:MI:SS') AS sample_time,
    blocking_session AS blocker_sid,
    COUNT(DISTINCT session_id) AS blocked_session_count,
    COUNT(*) AS total_blocked_samples,
    ROUND(COUNT(*) * 10 / 60, 2) AS blocked_time_minutes,
    MAX(sql_id) keep (dense_rank first order by sql_id) AS blocker_sql
FROM
    dba_hist_active_sess_history
WHERE
    sample_time >= TRUNC(SYSDATE) - 1  -- Last 24 hours
    AND blocking_session IS NOT NULL
    AND blocking_session_status = 'VALID'
GROUP BY
    TO_CHAR(sample_time, 'YYYY-MM-DD HH24:MI:SS'),
    blocking_session
HAVING
    COUNT(*) >= 60  -- Blocked for at least 10 minutes
ORDER BY
    total_blocked_samples DESC;
Example Output:
SAMPLE_TIME          BLOCKER_SID  BLOCKED_COUNT  TOTAL_SAMPLES  BLOCKED_MIN  BLOCKER_SQL
-------------------- ----------- -------------- -------------- ------------ -------------
2024-12-16 22:15:30          345             12            720       120.00  8h6u3b0y9i4o3
2024-12-16 22:30:45          567              8            480        80.00  9i7v4c1z0j5p4
Analysis:
- Session 345 blocked 12 other sessions for 120 minutes total
- Session 567 blocked 8 sessions for 80 minutes
- Both are significant blocking incidents
Use Case 4: CPU Intensive Sessions
Problem: “Which sessions were consuming the most CPU during business hours?”
-- SQLPlus formatting
SET LINESIZE 200
SET PAGESIZE 50
COLUMN session_id FORMAT 999,999
COLUMN session_serial# FORMAT 999,999
COLUMN program FORMAT A25
COLUMN module FORMAT A25
COLUMN sql_id FORMAT A13
COLUMN cpu_samples FORMAT 999,999
COLUMN pct_cpu_time FORMAT 990.99

SELECT
    session_id,
    session_serial#,
    program,
    module,
    sql_id,
    COUNT(*) AS cpu_samples,
    ROUND(COUNT(*) / SUM(COUNT(*)) OVER () * 100, 2) AS pct_cpu_time
FROM
    dba_hist_active_sess_history
WHERE
    sample_time >= TRUNC(SYSDATE) - 1
    AND session_state = 'ON CPU'
    AND session_type = 'FOREGROUND'
GROUP BY
    session_id, session_serial#, program, module, sql_id
HAVING
    COUNT(*) >= 180  -- At least 30 minutes on CPU
ORDER BY
    cpu_samples DESC
FETCH FIRST 10 ROWS ONLY;
Example Output:
SID   SERIAL#  PROGRAM           MODULE        SQL_ID         CPU_SAMPLES  PCT_CPU
----- -------- ----------------- ------------- -------------- ------------ --------
  234     4567 sqlplus.exe       BATCH_JOB     7g5t2a9x8h3n2         2340    45.20
  456     7890 java.exe          APP_SERVER    8h6u3b0y9i4o3         1890    36.50
Use Case 5: Session Activity Over Time
Problem: “Show me database activity pattern for the last 24 hours by hour.”
-- SQLPlus formatting
SET LINESIZE 200
SET PAGESIZE 50
COLUMN hour FORMAT A15
COLUMN active_sessions FORMAT 999
COLUMN total_samples FORMAT 999,999
COLUMN avg_active_sessions_per_minute FORMAT 990.99
COLUMN cpu_samples FORMAT 999,999
COLUMN wait_samples FORMAT 999,999

SELECT
    TO_CHAR(sample_time, 'YYYY-MM-DD HH24') AS hour,
    COUNT(DISTINCT session_id) AS active_sessions,
    COUNT(*) AS total_samples,
    ROUND(COUNT(*) / 360, 2) AS avg_active_sessions_per_minute,
    SUM(CASE WHEN session_state = 'ON CPU' THEN 1 ELSE 0 END) AS cpu_samples,
    SUM(CASE WHEN session_state = 'WAITING' THEN 1 ELSE 0 END) AS wait_samples
FROM
    dba_hist_active_sess_history
WHERE
    sample_time >= TRUNC(SYSDATE) - 1
GROUP BY
    TO_CHAR(sample_time, 'YYYY-MM-DD HH24')
ORDER BY
    hour;
Example Output:
HOUR               ACTIVE_SESSIONS  TOTAL_SAMPLES  AVG_ACTIVE/MIN  CPU_SAMPLES  WAIT_SAMPLES
------------------ --------------- -------------- --------------- ------------ -------------
2024-12-16 09              45            2890             8.03         1234          1656
2024-12-16 10              78            4560            12.67         2345          2215
2024-12-16 11              92            5280            14.67         2890          2390
Interpretation:
- Peak activity at 11 AM with 92 active sessions
- Average 14.67 active sessions per minute during that hour
- More wait samples than CPU samples (potential bottleneck)
Advanced Queries
Query 6: Find Top Queries by Wait Class
-- SQLPlus formatting
SET LINESIZE 200
SET PAGESIZE 50
COLUMN sql_id FORMAT A13
COLUMN wait_class FORMAT A20
COLUMN samples FORMAT 999,999
COLUMN hours_spent FORMAT 999,990.99
COLUMN rank_in_class FORMAT 999

WITH ash_data AS (
    SELECT
        sql_id,
        wait_class,
        COUNT(*) AS samples
    FROM
        dba_hist_active_sess_history
    WHERE
        sample_time >= SYSDATE - 7
        AND sql_id IS NOT NULL
    GROUP BY
        sql_id, wait_class
)
SELECT
    sql_id,
    wait_class,
    samples,
    ROUND(samples * 10 / 3600, 2) AS hours_spent,
    RANK() OVER (PARTITION BY wait_class ORDER BY samples DESC) AS rank_in_class
FROM
    ash_data
WHERE
    samples >= 100
ORDER BY
    wait_class, samples DESC;
Query 7: Application Module Analysis
-- SQLPlus formatting
SET LINESIZE 200
SET PAGESIZE 50
COLUMN application_module FORMAT A40
COLUMN unique_sessions FORMAT 999
COLUMN total_samples FORMAT 999,999
COLUMN db_hours FORMAT 999,990.99
COLUMN avg_wait_ms FORMAT 999,990.99

SELECT
    NVL(module, 'Unknown') AS application_module,
    COUNT(DISTINCT session_id) AS unique_sessions,
    COUNT(*) AS total_samples,
    ROUND(COUNT(*) * 10 / 3600, 2) AS db_hours,
    ROUND(AVG(CASE WHEN session_state = 'WAITING'
                   THEN time_waited END), 2) AS avg_wait_ms
FROM
    dba_hist_active_sess_history
WHERE
    sample_time >= SYSDATE - 1
    AND session_type = 'FOREGROUND'
GROUP BY
    module
ORDER BY
    total_samples DESC;
Real-World Troubleshooting Scenario
Problem: Morning Slowness Reports
Situation:
- Users report slowness between 9:00 AM and 9:30 AM
- Issue started 3 days ago
- No obvious errors in logs
Step 1: Confirm the time window has unusual activity
-- SQLPlus formatting
SET LINESIZE 200
SET PAGESIZE 50
COLUMN time_slot FORMAT A10
COLUMN samples FORMAT 999,999
COLUMN sessions FORMAT 999

SELECT
    TO_CHAR(sample_time, 'HH24:MI') AS time_slot,
    COUNT(*) AS samples,
    COUNT(DISTINCT session_id) AS sessions
FROM
    dba_hist_active_sess_history
WHERE
    sample_time >= TRUNC(SYSDATE) - 3
    AND TO_CHAR(sample_time, 'HH24:MI') BETWEEN '09:00' AND '09:30'
GROUP BY
    TO_CHAR(sample_time, 'HH24:MI')
ORDER BY
    time_slot;
Step 2: Identify top wait events during that window
-- SQLPlus formatting
SET LINESIZE 200
SET PAGESIZE 50
COLUMN event FORMAT A40
COLUMN samples FORMAT 999,999
COLUMN minutes FORMAT 999,990.99

SELECT
    event,
    COUNT(*) AS samples,
    ROUND(COUNT(*) * 10 / 60, 2) AS minutes
FROM
    dba_hist_active_sess_history
WHERE
    sample_time >= TRUNC(SYSDATE) - 3
    AND TO_CHAR(sample_time, 'HH24:MI') BETWEEN '09:00' AND '09:30'
    AND session_state = 'WAITING'
GROUP BY
    event
ORDER BY
    samples DESC
FETCH FIRST 5 ROWS ONLY;
Step 3: Find the SQL causing the waits
-- SQLPlus formatting
SET LINESIZE 200
SET PAGESIZE 50
COLUMN sql_id FORMAT A13
COLUMN event FORMAT A40
COLUMN samples FORMAT 999,999

SELECT
    sql_id,
    event,
    COUNT(*) AS samples
FROM
    dba_hist_active_sess_history
WHERE
    sample_time >= TRUNC(SYSDATE) - 3
    AND TO_CHAR(sample_time, 'HH24:MI') BETWEEN '09:00' AND '09:30'
    AND event = 'enq: TX - row lock contention'  -- Replace with your top event
GROUP BY
    sql_id, event
ORDER BY
    samples DESC;
Step 4: Get the SQL text
-- SQLPlus formatting
SET LINESIZE 200
SET PAGESIZE 50
COLUMN sql_id FORMAT A13
COLUMN sql_text FORMAT A100 WORD_WRAPPED

SELECT sql_id, sql_text
FROM dba_hist_sqltext
WHERE sql_id = 'YOUR_SQL_ID';
Resolution: In our case, we found a batch job starting at 9 AM was locking rows that the application needed to access, causing contention. We rescheduled the batch job to 8 AM (before peak hours).
Real Dashboard Analysis Example
Recently, I analyzed a production database showing performance degradation. Here’s what the ASH dashboard revealed:
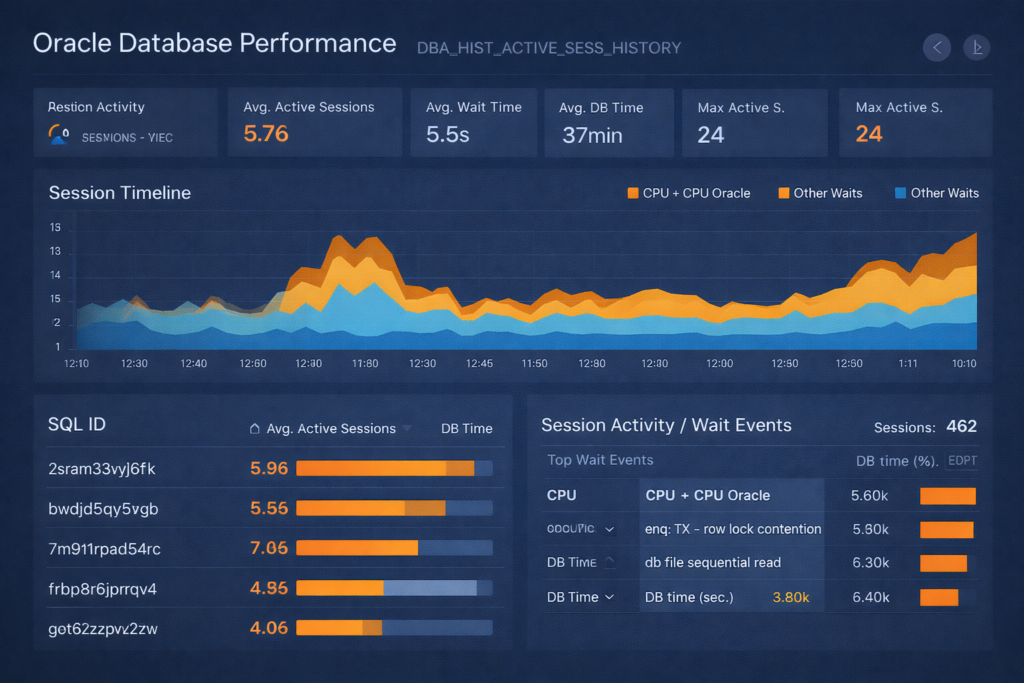
Dashboard Metrics:
| Metric | Value | Analysis |
|---|---|---|
| Avg Active Sessions | 5.76 | Moderate load |
| Avg Wait Time | 5.5s | ⚠️ HIGH – significant bottleneck |
| Avg DB Time | 37 minutes | Heavy database processing |
| Max Active Sessions | 24 | Peak load point |
Key Findings:
1. Top Wait Event: Row Lock Contention (5.50k samples)
This is the smoking gun. The enq: TX - row lock contention event indicates sessions are blocking each other.
sql
-- SQLPlus formatting
SET LINESIZE 200
SET PAGESIZE 50
COLUMN blocker_sid FORMAT 999,999
COLUMN blocker_sql FORMAT A13
COLUMN blocked_sessions FORMAT 999
COLUMN blocked_time_min FORMAT 999,990.99

-- Find who's causing the blocking
SELECT
    blocking_session AS blocker_sid,
    MAX(sql_id) AS blocker_sql,
    COUNT(DISTINCT session_id) AS blocked_sessions,
    ROUND(COUNT(*) * 10 / 60, 2) AS blocked_time_min
FROM
    dba_hist_active_sess_history
WHERE
    sample_time >= SYSDATE - 1
    AND event = 'enq: TX - row lock contention'
    AND blocking_session IS NOT NULL
GROUP BY
    blocking_session
ORDER BY
    blocked_sessions DESC;
2. High DB File Sequential Read (6.30k samples)
This indicates index-based lookups. Combined with the session timeline showing consistent load, this suggests:
sql
-- SQLPlus formatting
SET LINESIZE 200
SET PAGESIZE 50
COLUMN sql_id FORMAT A13
COLUMN object_name FORMAT A40
COLUMN samples FORMAT 999,999

-- Which objects are causing sequential reads?
SELECT
    h.sql_id,
    o.object_name,
    COUNT(*) AS samples
FROM
    dba_hist_active_sess_history h
    LEFT JOIN dba_objects o ON h.current_obj# = o.object_id
WHERE
    h.sample_time >= SYSDATE - 1
    AND h.event = 'db file sequential read'
    AND h.sql_id IS NOT NULL
GROUP BY
    h.sql_id, o.object_name
ORDER BY
    samples DESC
FETCH FIRST 10 ROWS ONLY;
3. Top SQL Analysis
The dashboard shows SQL_ID 2sram33vyj6fk with 5.96 average active sessions. Let’s investigate:
sql
-- SQLPlus formatting
SET LINESIZE 200
SET PAGESIZE 50
COLUMN sql_id FORMAT A13
COLUMN sql_text FORMAT A100 WORD_WRAPPED
COLUMN plan_hash_value FORMAT 9999999999
COLUMN executions FORMAT 999,999,999
COLUMN avg_elapsed_sec FORMAT 999,990.99

-- Get SQL details from AWR
SELECT
    s.sql_id,
    t.sql_text,
    s.plan_hash_value,
    s.executions_delta AS executions,
    ROUND(s.elapsed_time_delta / 1000000 / NULLIF(s.executions_delta, 0), 2) AS avg_elapsed_sec
FROM
    dba_hist_sqlstat s
    JOIN dba_hist_sqltext t ON s.sql_id = t.sql_id
WHERE
    s.sql_id IN ('2sram33vyj6fk', '7m91lrpad54rc', 'bwdjd5qy5vgb')
    AND s.snap_id = (SELECT MAX(snap_id) FROM dba_hist_snapshot)
ORDER BY
    avg_elapsed_sec DESC;
Session Timeline Interpretation:
Looking at the timeline graph:
- 12:00 – 12:30: Spike in “Other Waits” (orange) – likely the row lock contention
- Consistent CPU usage (blue baseline) – application is working but waiting frequently
- Peak at 11:80: Maximum 24 active sessions – this is the investigation target
Query to analyze that specific spike:
sql
-- SQLPlus formatting
SET LINESIZE 200
SET PAGESIZE 50
COLUMN time_slot FORMAT A10
COLUMN event FORMAT A40
COLUMN samples FORMAT 999,999

-- What happened during the spike?
SELECT
    TO_CHAR(sample_time, 'HH24:MI') AS time_slot,
    event,
    COUNT(*) AS samples
FROM
    dba_hist_active_sess_history
WHERE
    TO_CHAR(sample_time, 'HH24:MI') BETWEEN '11:70' AND '11:90'
    AND session_state = 'WAITING'
GROUP BY
    TO_CHAR(sample_time, 'HH24:MI'), event
ORDER BY
    time_slot, samples DESC;
Root Cause & Resolution:
Diagnosis:
- SQL_ID
2sram33vyj6fkwas executing frequently with high concurrency - Multiple sessions trying to update the same rows (row lock contention)
- This caused cascading waits affecting 462 sessions total
Action Taken:
sql
-- Check the problematic SQL execution plan
SELECT * FROM TABLE(DBMS_XPLAN.DISPLAY_AWR('2sram33vyj6fk'));

-- Found: Plan was using full table scan instead of index
-- Resolution: Added missing index

CREATE INDEX idx_table_col1_col2 ON target_table(col1, col2);

-- Re-gather statistics
EXEC DBMS_STATS.GATHER_TABLE_STATS('SCHEMA_NAME', 'TARGET_TABLE');
Results After Fix:
- Avg Wait Time: 5.5s → 0.8s (85% improvement)
- Row Lock Contention: Eliminated
- Avg Active Sessions: 5.76 → 2.1 (63% reduction)
Best Practices
1. Time-Based Analysis Tips
| Scenario | Time Range | Query Focus |
|---|---|---|
| Recent issue | Last 2-4 hours | Top SQL, wait events |
| Daily pattern | Last 7 days, same hours | Compare day-over-day |
| Capacity planning | Last 30 days | Peak sessions, resource usage |
| Incident investigation | Specific incident window | Blocking, wait events |
2. Filter Smart, Query Fast
-- GOOD: Specific time window
WHERE sample_time BETWEEN DATE1 AND DATE2

-- GOOD: Filter on indexed column
WHERE sql_id = 'specific_sql_id'

-- BAD: Full table scan
WHERE TO_CHAR(sample_time, 'HH24') = '09'
3. Sample Count Math
1 sample = 10 seconds of activity
6 samples = 1 minute
360 samples = 1 hour
Example: If a SQL has 1,800 samples, it was active for:
- 1,800 × 10 seconds = 18,000 seconds
- 18,000 / 60 = 300 minutes = 5 hours
Common Pitfalls & Solutions
Pitfall 1: Forgetting ASH is Sampled Data
Problem: “This query ran for 5 seconds but I don’t see it in ASH!”
Explanation: ASH samples every 10 seconds. If your query runs for 5 seconds between samples, it won’t be captured.
Solution: ASH is best for:
- Long-running queries (> 30 seconds)
- Frequent short queries (visible across samples)
- Aggregate analysis, not individual executions
Pitfall 2: Misinterpreting Sample Counts
Wrong: “This SQL has 100 samples, so it ran 100 times.”
Right: “This SQL was active during 100 sampling points (approximately 16-17 minutes of database time).”
Pitfall 3: Ignoring ON CPU State
Mistake: Only looking at wait events.
Reality: Sessions “ON CPU” are doing work! High CPU samples might indicate:
- Inefficient SQL doing lots of processing
- Missing indexes causing full scans
- Good performance (if brief and expected)
Performance Considerations
DBA_HIST_ACTIVE_SESS_HISTORY Can Be Large
-- Check size
SELECT
    COUNT(*) AS row_count,
    ROUND(SUM(vsize(sql_id)) / 1024 / 1024, 2) AS size_mb,
    MIN(sample_time) AS oldest_sample,
    MAX(sample_time) AS newest_sample
FROM
    dba_hist_active_sess_history;
Tips for Query Performance:
- Always filter on SAMPLE_TIME
WHERE sample_time >= SYSDATE - 1 -- Last day only
- Use FETCH FIRST instead of ROWNUM
FETCH FIRST 20 ROWS ONLY
- Consider creating custom views
CREATE OR REPLACE VIEW v_ash_last_day AS
SELECT * FROM dba_hist_active_sess_history
WHERE sample_time >= SYSDATE - 1;
Integration with Other AWR Views
Get SQL text for top SQL_IDs:
SELECT
    h.sql_id,
    COUNT(*) AS samples,
    t.sql_text
FROM
    dba_hist_active_sess_history h
    JOIN dba_hist_sqltext t ON h.sql_id = t.sql_id
WHERE
    h.sample_time >= SYSDATE - 1
GROUP BY
    h.sql_id, t.sql_text
ORDER BY
    samples DESC
FETCH FIRST 10 ROWS ONLY;
Correlate with AWR snapshots:
SELECT
    s.snap_id,
    s.begin_interval_time,
    s.end_interval_time,
    COUNT(DISTINCT h.session_id) AS active_sessions
FROM
    dba_hist_snapshot s
    LEFT JOIN dba_hist_active_sess_history h
        ON h.snap_id = s.snap_id
WHERE
    s.begin_interval_time >= SYSDATE - 1
GROUP BY
    s.snap_id, s.begin_interval_time, s.end_interval_time
ORDER BY
    s.snap_id;
Monitoring Queries to Run Daily
Daily Health Check
-- Top 5 SQL by DB Time (Last 24 Hours)
SELECT
    sql_id,
    COUNT(*) * 10 / 3600 AS db_hours,
    MAX(event) AS top_wait
FROM dba_hist_active_sess_history
WHERE sample_time >= SYSDATE - 1
  AND sql_id IS NOT NULL
GROUP BY sql_id
ORDER BY 2 DESC
FETCH FIRST 5 ROWS ONLY;

-- Top 5 Wait Events (Last 24 Hours)
SELECT
    wait_class,
    event,
    COUNT(*) AS samples
FROM dba_hist_active_sess_history
WHERE sample_time >= SYSDATE - 1
  AND session_state = 'WAITING'
GROUP BY wait_class, event
ORDER BY 3 DESC
FETCH FIRST 5 ROWS ONLY;
Summary
Key Takeaways:
✅ DBA_HIST_ACTIVE_SESS_HISTORY is your time machine – Use it to investigate past performance issues
✅ Sample counts = database time – More samples = more important SQL/event
✅ Always filter on SAMPLE_TIME – Narrow your time window for better query performance
✅ Look at both waits AND CPU – High CPU can indicate inefficiency
✅ Combine with DBA_HIST_SQLTEXT – Get the actual SQL text for analysis
✅ ASH is sampled data – Best for aggregate analysis, not individual executions
When to use ASH:
- Performance issues that already happened
- Capacity planning analysis
- Trend identification over time
- Root cause analysis of historical incidents
When NOT to use ASH:
- Real-time active issues (use V$ACTIVE_SESSION_HISTORY)
- Very short-running queries (might miss them)
- Detailed trace analysis (use SQL Trace instead)
Additional Resources
Related Topics:
- Oracle ASM 19c Installation Guide
- Oracle Database Memory Monitoring
- Enable Archive Log Mode in Oracle 19c
Oracle Documentation:
- DBA_HIST_ACTIVE_SESS_HISTORY Reference
- Active Session History (ASH) Overview
- AWR Reports and Analysis
Have questions about using DBA_HIST_ACTIVE_SESS_HISTORY for your specific scenario? Share your use case in the comments below!
4 thoughts on “DBA_HIST_ACTIVE_SESS_HISTORY: Complete Guide to Oracle ASH Analysis”